Quantum Bit Error Rate: Gate-by-Gate Noise Characterization
A systematic sweep of QBER across four quantum gates, two noise models, and two circuit topologies — and what the results revealed about measurement basis and noise sensitivity.
This is Part 2 of a two-part series on quantum-classical simulation. Part 1 covered how I used Qiskit circuits to simulate classical diversity combining — SC, EGC, and MRC — over Rayleigh fading channels. This post goes deeper into quantum bit error rate (QBER) specifically, and what running a systematic sweep across gate types taught me about how noise behaves differently depending on what your circuit is actually doing.
What QBER Measures and Why Gate Choice Matters
| Quantum Bit Error Rate is the probability that a qubit, measured after passing through a noisy channel, returns the wrong answer. In this experiment, “wrong” has a specific meaning: the circuit prepares each qubit in the | +⟩ state — a superposition equally weighted between | 0⟩ and | 1⟩ — applies a gate with injected noise, and then measures back in the X-basis by applying a Hadamard before measurement. A clean channel should return the correct state most of the time. QBER quantifies how often it doesn’t. |
What I didn’t fully appreciate before running this experiment is how much the gate type determines the noise sensitivity, independent of the noise strength. Two circuits with identical noise parameters can produce dramatically different QBER values depending on which gate the noise is attached to. That gate-dependency is the central finding this post documents.
The reason comes down to measurement basis alignment. Phase-flip noise (Z errors) only creates detectable errors when you’re measuring in a basis that is sensitive to phase — which the X-basis is. Depolarizing noise spreads errors symmetrically across X, Y, and Z, so only a fraction of its errors land in the measurement-visible direction. Some gates, by their construction, rotate the qubit into configurations where phase errors are highly visible. Others effectively hide both noise types behind an already-random measurement outcome. The gate is not just a computation — it’s a noise exposure surface.
How the Experiment Was Structured
The experiment runs 100 distinct combinations: four gate types (U, X, H, CX), five qubit counts (1 through 5), and five shot counts (1024 through 5120 in steps of 1024). For each combination, I simulated QBER under two noise models — depolarizing and phase-flip — and across two circuit topologies: independent channels (each qubit gets noise separately, no inter-qubit interaction) and entangled circuits (a CNOT chain spreads entanglement before the noisy gate is applied). Each noise sweep runs from p = 0 to p = 1.0 in steps of 0.05, giving 21 noise points per curve.
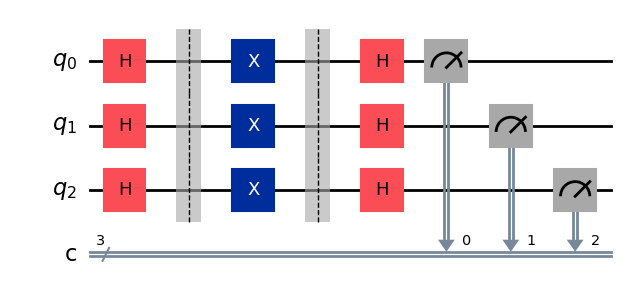
The circuit diagrams below show the structural difference between the two topologies for a 3-qubit, X-gate case.
| {: width=”800” height=”300”} |
| *Figure 1: Independent topology — each qubit sees noise in isolation. H prepares | +⟩, X applies the noisy gate, final H rotates back to Z-basis for measurement.* |
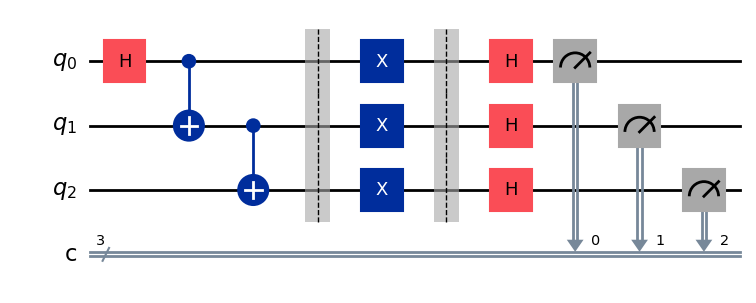 Figure 2: Entangled topology — a CNOT chain spreads entanglement across all qubits before the noisy gate is applied.
Total simulation runs: 100 combinations × 21 noise points × 2 topologies × 2 noise models = 8,400 individual circuit executions. That’s not a toy sample.
The Two Noise Models and Why They Behave Differently
Understanding the numerical results requires understanding what each noise model is actually doing to the qubit.
Depolarizing noise applies a random Pauli error — X, Y, or Z — with equal probability p/3 each, leaving the qubit unchanged with probability 1 − p. Because errors are spread across all three axes, and the measurement only detects errors along one axis at a time, depolarizing QBER is bounded: it asymptotes toward 0.5 as p approaches 1.0. At maximum noise strength, you get a coin flip — no signal, but not worse than chance.
| Phase-flip noise is different. It applies only a Z error with probability p, leaving the qubit unchanged with probability 1 − p. Z errors are invisible in the Z-basis (they don’t flip | 0⟩ to | 1⟩) but they are fully destructive in the X-basis, because they flip the relative phase between | +⟩ and | −⟩. The circuit in this experiment measures in the X-basis, which means phase-flip errors are maximally detectable. At p = 1.0, every qubit is phase-flipped, every measurement returns the wrong answer, and QBER reaches 1.0 exactly. |
This asymmetry — depolarizing capping at 0.5, phase-flip reaching 1.0 — is the mathematical foundation for the consistent ~2× QBER gap observed throughout the experiment.
Gate-by-Gate QBER: What the Simulation Showed
The preliminary single-qubit experiment, run before the systematic sweep, already hinted at the H-gate anomaly: both noise curves were flat near 0.5 regardless of noise strength, which looked like a malfunction before I understood why.
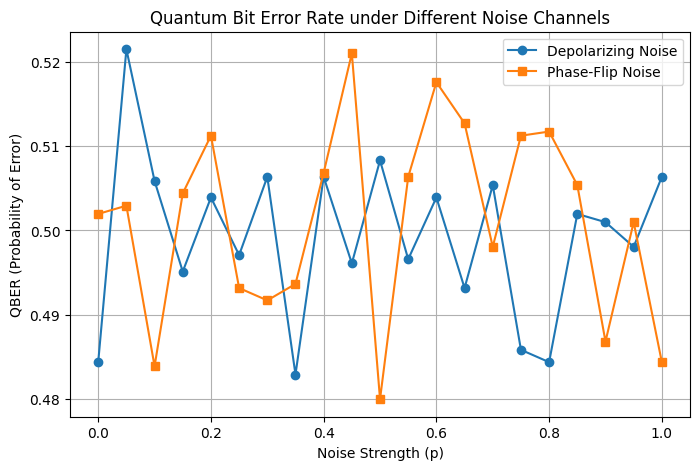 Figure 3: The preliminary experiment — both noise curves flatline near 0.5. This was the first signal that the H gate behaves fundamentally differently under noise.
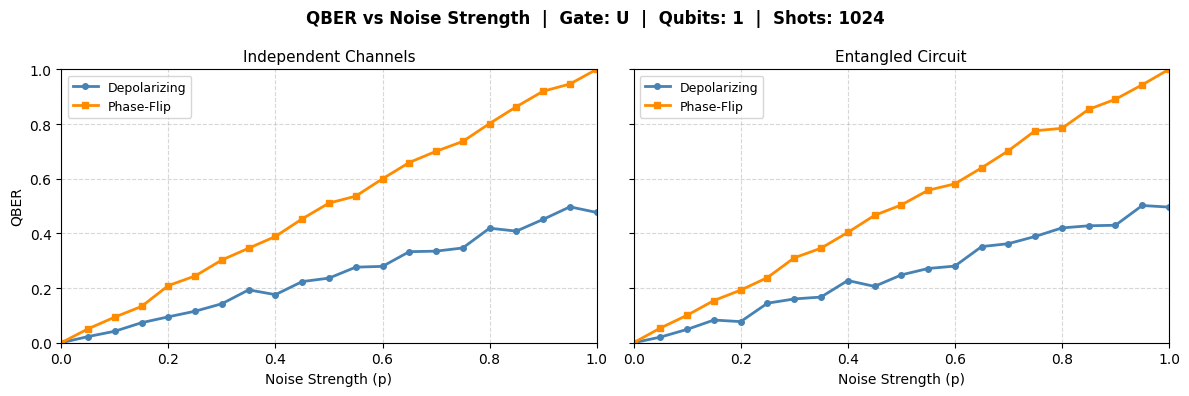
U gate and X gate produce the clearest, most interpretable results. QBER rises monotonically from 0 at p = 0 to approximately 0.5 (depolarizing) and 1.0 (phase-flip) at p = 1.0. The ~2× gap between the two noise models is consistent across all qubit counts. At p = 0.1, depolarizing QBER sits around 0.05 and phase-flip around 0.10 — a 2× ratio that holds across the full sweep. At p = 0.49, depolarizing is approximately 0.25 while phase-flip is approximately 0.48.
Figure 4: U gate, 1 qubit, 1024 shots. The ~2× QBER gap between phase-flip and depolarizing noise is visible and consistent across both topologies. This is the expected result — and seeing it confirm cleanly was the validation that the noise injection was working correctly.
The H gate is where the experiment gets interesting. Across every qubit count, every shot count, and both topologies, H-gate QBER flatlines between 0.48 and 0.52 for both noise types. Increasing noise strength from 0 to 1.0 produces no meaningful change.
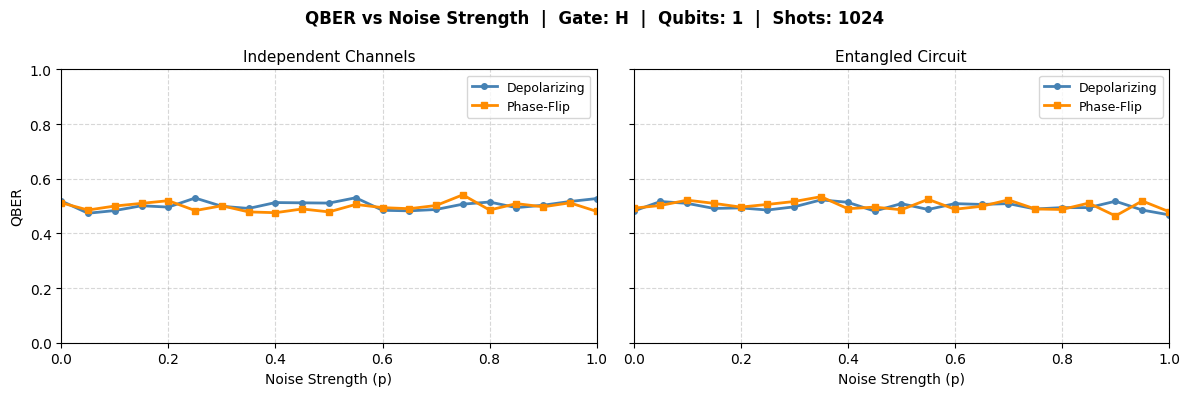 Figure 5: H gate, 1 qubit, 1024 shots. Both noise types produce flat QBER near 0.5 — noise strength is irrelevant. The gate has already rendered the measurement maximally uncertain.
| This isn’t noise immunity. It’s a measurement basis problem. The circuit prepares the qubit in | +⟩, applies H, and measures in the X-basis. Applying H to | +⟩ produces | 0⟩ — which is already a Z-basis eigenstate, not an X-basis superposition. Measuring this state in the X-basis returns | 0⟩ or | 1⟩ with equal probability regardless of what noise did, because the state has no X-basis coherence to preserve or corrupt. Any noise on top of this just perturbs an already-random outcome. The circuit was producing a near-random measurement before noise even entered the picture. |
This is one of those results that looks like a bug until you work through the math. The lesson I took: always verify that your circuit is in a state where noise is actually detectable in your chosen measurement basis before interpreting QBER values.
The CX gate behaves consistently with U and X — monotonic rise, ~2× phase-flip vs depolarizing gap — which confirms the noise injection is working correctly for 2-qubit operations as well.
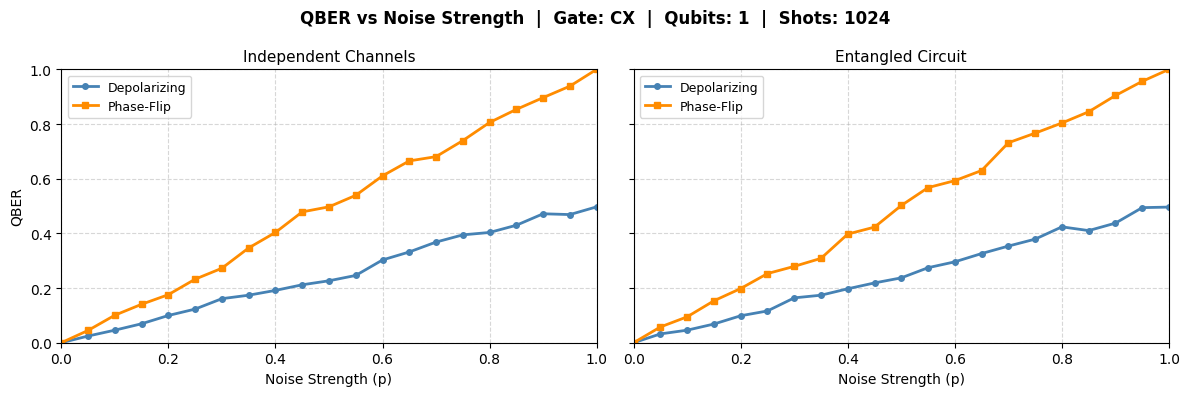 Figure 6: CX gate, 1 qubit, 1024 shots (CX falls back to a U gate for single-qubit configurations). Consistent monotonic behavior, confirming the noise model generalizes correctly to 2-qubit gate configurations.
The H gate result is the sharpest reminder in this experiment that QBER measures the interaction between noise and measurement basis — not noise alone. A gate that produces a maximally uncertain measurement state will report 0.5 QBER even in a perfectly noiseless circuit.
Entangled vs Independent: A Topology Comparison
This is the result I most expected to show a difference — and it didn’t.
Across all gate types, qubit counts, and shot counts, the independent and entangled circuit topologies produce nearly identical QBER curves. The side-by-side plots (Figures 4, 5, 6) make this visible: left panel (independent) and right panel (entangled) are essentially overlapping curves throughout.
My expectation going in was that entanglement would create correlated errors — a phase-flip on one qubit propagating through the CNOT chain and inflating the per-qubit QBER in the entangled case. That didn’t happen at any measurable scale.
The most likely explanation is circuit depth and noise placement. In this experiment, noise is injected at the gate layer, which in the entangled topology comes after the CNOT chain has already run. By the time noise acts, the entangled state is already established, and the noise perturbs each qubit locally at that point — similar to how it would in the independent case. For entanglement to meaningfully amplify error propagation, you’d need noise that acts during or before the entangling operations, or deeper circuits where noise has more opportunities to interact with the entangled structure.
This is an honest null result. The topology comparison, as designed, doesn’t surface error propagation through entanglement — but understanding why it doesn’t is itself useful. It tells you something about what noise models need to capture if you want to study entanglement-mediated error spreading, and it points toward where future experiments should focus: earlier noise injection, deeper circuits, or multi-qubit correlated noise operators.
Shot Count and Convergence
The shot count sweep (1024, 2048, 3072, 4096, 5120) was included to understand how much sampling noise affects QBER estimates. The answer is: meaningfully at 1024, minimally above 2048.
At 1024 shots, the QBER curves show visible jaggedness — the monotonic trend is clear, but individual noise-strength points jump around by ±0.02 to ±0.04. By 2048 shots, the curves smooth out considerably. Beyond 3072, the improvement is marginal — the curves are stable and the topology comparison is reliable.
For this type of experiment — single-qubit and small multi-qubit circuits, 21 noise points, comparative topologies — 2048 shots is the practical minimum for trustworthy results. Lower than that and you risk mistaking shot noise fluctuations for real differences between conditions.
The practical guideline I’m taking forward: when comparing two conditions (topologies, noise models, gate types), use at least 2048 shots and plot both conditions on the same axes rather than comparing separate plots. The side-by-side layout used throughout this experiment makes it immediately obvious when curves are identical versus when they diverge.
Key Takeaways
-
Gate type determines noise sensitivity as much as noise strength does. The U and X gates expose the ~2× depolarizing vs phase-flip gap cleanly. The H gate hides all noise behind an already-random measurement outcome. Gate choice is not separable from QBER interpretation.
-
Phase-flip noise is consistently more damaging than depolarizing in an X-basis measurement setup. At every noise strength tested, phase-flip QBER is approximately double the depolarizing value for phase-sensitive gates. This isn’t a numerical accident — it follows directly from how Z errors interact with X-basis measurements.
-
The H-gate flatline is a measurement basis artifact, not noise immunity. A QBER of 0.5 does not mean the circuit is robust. It means the circuit is already maximally uncertain before noise acts. Always verify basis alignment before interpreting QBER values.
-
Entanglement did not amplify per-qubit QBER in this design. The independent and entangled topologies converge to the same curves. Understanding why — noise placement relative to the entangling layer — points toward what a more sophisticated entanglement noise study would need to do differently.
-
2048 shots is the practical convergence threshold for circuits of this scale and noise sweep density. Beyond that, the marginal smoothing from additional shots doesn’t change the conclusions.
Harshit is an Associate Principal Engineer pursuing the Post-Graduate Diploma in Advanced Communication Engineering with Quantum and AI Integration at IIT Delhi. This post reflects independent simulation work done as part of that programme.
Ideation and creation by human, written and formatted by AI